Profiling slow tests
04 01 Problem (🏁 solution)
With the
vitest-profiler plugin added to my vitest.config.ts, I can run the tests in the profiler mode to see what takes them so long.npx vitest-profiler npm test
Or usingnpm run test:profilescript I have in mypackage.json.
This will run my tests in a special way, enabling performance profiling in Vitest. Let's be a bit more specific as to what
vitest-profiler actually does:- Spawns your test suite with Node.js performance profiling options enabled (e.g.
--cpu-prof). This allows it to measure Vitest performance as it runs your tests. - Attaches similar profiling flags to individual threads/forks that run your tests. This measures the performance of individual test files.
- Emits CPU and heap profiles gathered from the test run.
This is what it looks like when the profiler is finished running:
 ✓ src/rows.test.ts (1 test) 584ms
   ✓ retrieves all the rows  583ms

 Test Files  1 passed (1)
      Tests  1 passed (1)
   Start at  11:13:35
   Duration  757ms (transform 18ms, setup 0ms, collect 13ms, tests 584ms, environment 0ms, prepare 32ms)

Test profiling complete! Generated the following profiles:

  main-thread:
    - CPU:      /test-profiles/2025-04-21--09-13-35--main-thread.cpuprofile

  tests:
    - CPU:      /test-profiles/2025-04-21--09-13-35--tests.cpuprofile
    - Heap:     /test-profiles/2025-04-21--09-13-35--tests.heapprofile
I've highlighted the additional report added byvitest-profiler. We are going to take a deeper look into it in a moment.
Next, let's analyze the report, starting from what all of this information actually means.
Time metrics
The first important piece of data I will look at is the time metrics from Vitest:
 Test Files  1 passed (1)
      Tests  1 passed (1)
   Start at  11:13:35
   Duration  757ms (transform 18ms, setup 0ms, collect 13ms, tests 584ms, environment 0ms, prepare 32ms)
This information is available each time you run your tests and is not exclusive to the profiling mode. Here, Vitest accumulates the time it took to run your tests and splits it in several groups:
transform, the time it took to transform your tests. For example, transpile TypeScript to JavaScript or JSX toReact.createElement()calls;setup, the time it took to run yoursetupFiles;collect, the time it took to locate all the test files on disk;tests, the time it took to actually run your test cases;environment, the time it took to set up and tear down your test environment;prepare, the time it took for Vitest to prepare the test runner.
This overview is a fantastic starting point in identifying which areas of your test run are the slowest. For instance, I can see that Vitest spent most time running the tests:
transform 18ms,
setup 0ms,
collect 13ms,
tests 584ms,
environment 0ms,
prepare 32ms
Your test duration summary will likely be different. See which phases took the most time to know where you should direct your further investigation. For example, if thesetupphase is too slow, it may be because your test setup is too heavy and should be refactored. Ifcollectis lagging behind, it may mean that Vitest has trouble scraping your large monorepo and you should help it locate the test files by providing explicitincludeandexcludeoptions in your Vitest configuration.
With this covered, let's move on to the
vitest-profiler report.Profiler report
vitest-profiler gathers CPU and memory profiles for two things:- Main thread, which is a Node.js process that spawned Vitest. This roughly corresponds to the
prepare,collect,transform, andenvironmentphases from the Vitest's time metrics; - Tests, which is individual threads/forks that ran your test files. This roughly corresponds to the
teststime metric.
These separate profiles allow you to take a peek behind the curtain of your test runtime. You can get an idea of what your testing framework is doing and what your tests are doing, and, hopefully, spot the root cause for that nasty performance degradation.
CPU and memory profiles reflect different aspects of your test run:
- CPU profile shows you the CPU consumption. This will generally point you toward code that takes too much time to run;
- Memory (or heap) profile shows you the memory consumption. This is handy to watch for memory leaks and heaps that can also negatively impact your test performance.
Next, I will explore each individual profile in more detail.
Main thread profiles
One of the first things the profiler reports is a CPU profile for the main thread:
Test profiling complete! Generated the following profiles:

  main-thread:
    - CPU:      /test-profiles/2025-04-21--09-13-35--main-thread.cpuprofile

  tests:
    - CPU:      /test-profiles/2025-04-21--09-13-35--tests.cpuprofile
    - Heap:     /test-profiles/2025-04-21--09-13-35--tests.heapprofile
This profile represents the CPU usage of the Vitest's main process (the one that collects the test files, prepares the runner, runs the test environment, etc). I can open that file in any tooling that supports the
*.cpuprofile format, like the built-in "Profiler" in my browser, or I can also open it directly in Visual Studio Code!Here's how the CPU profile for the main thread looks like:
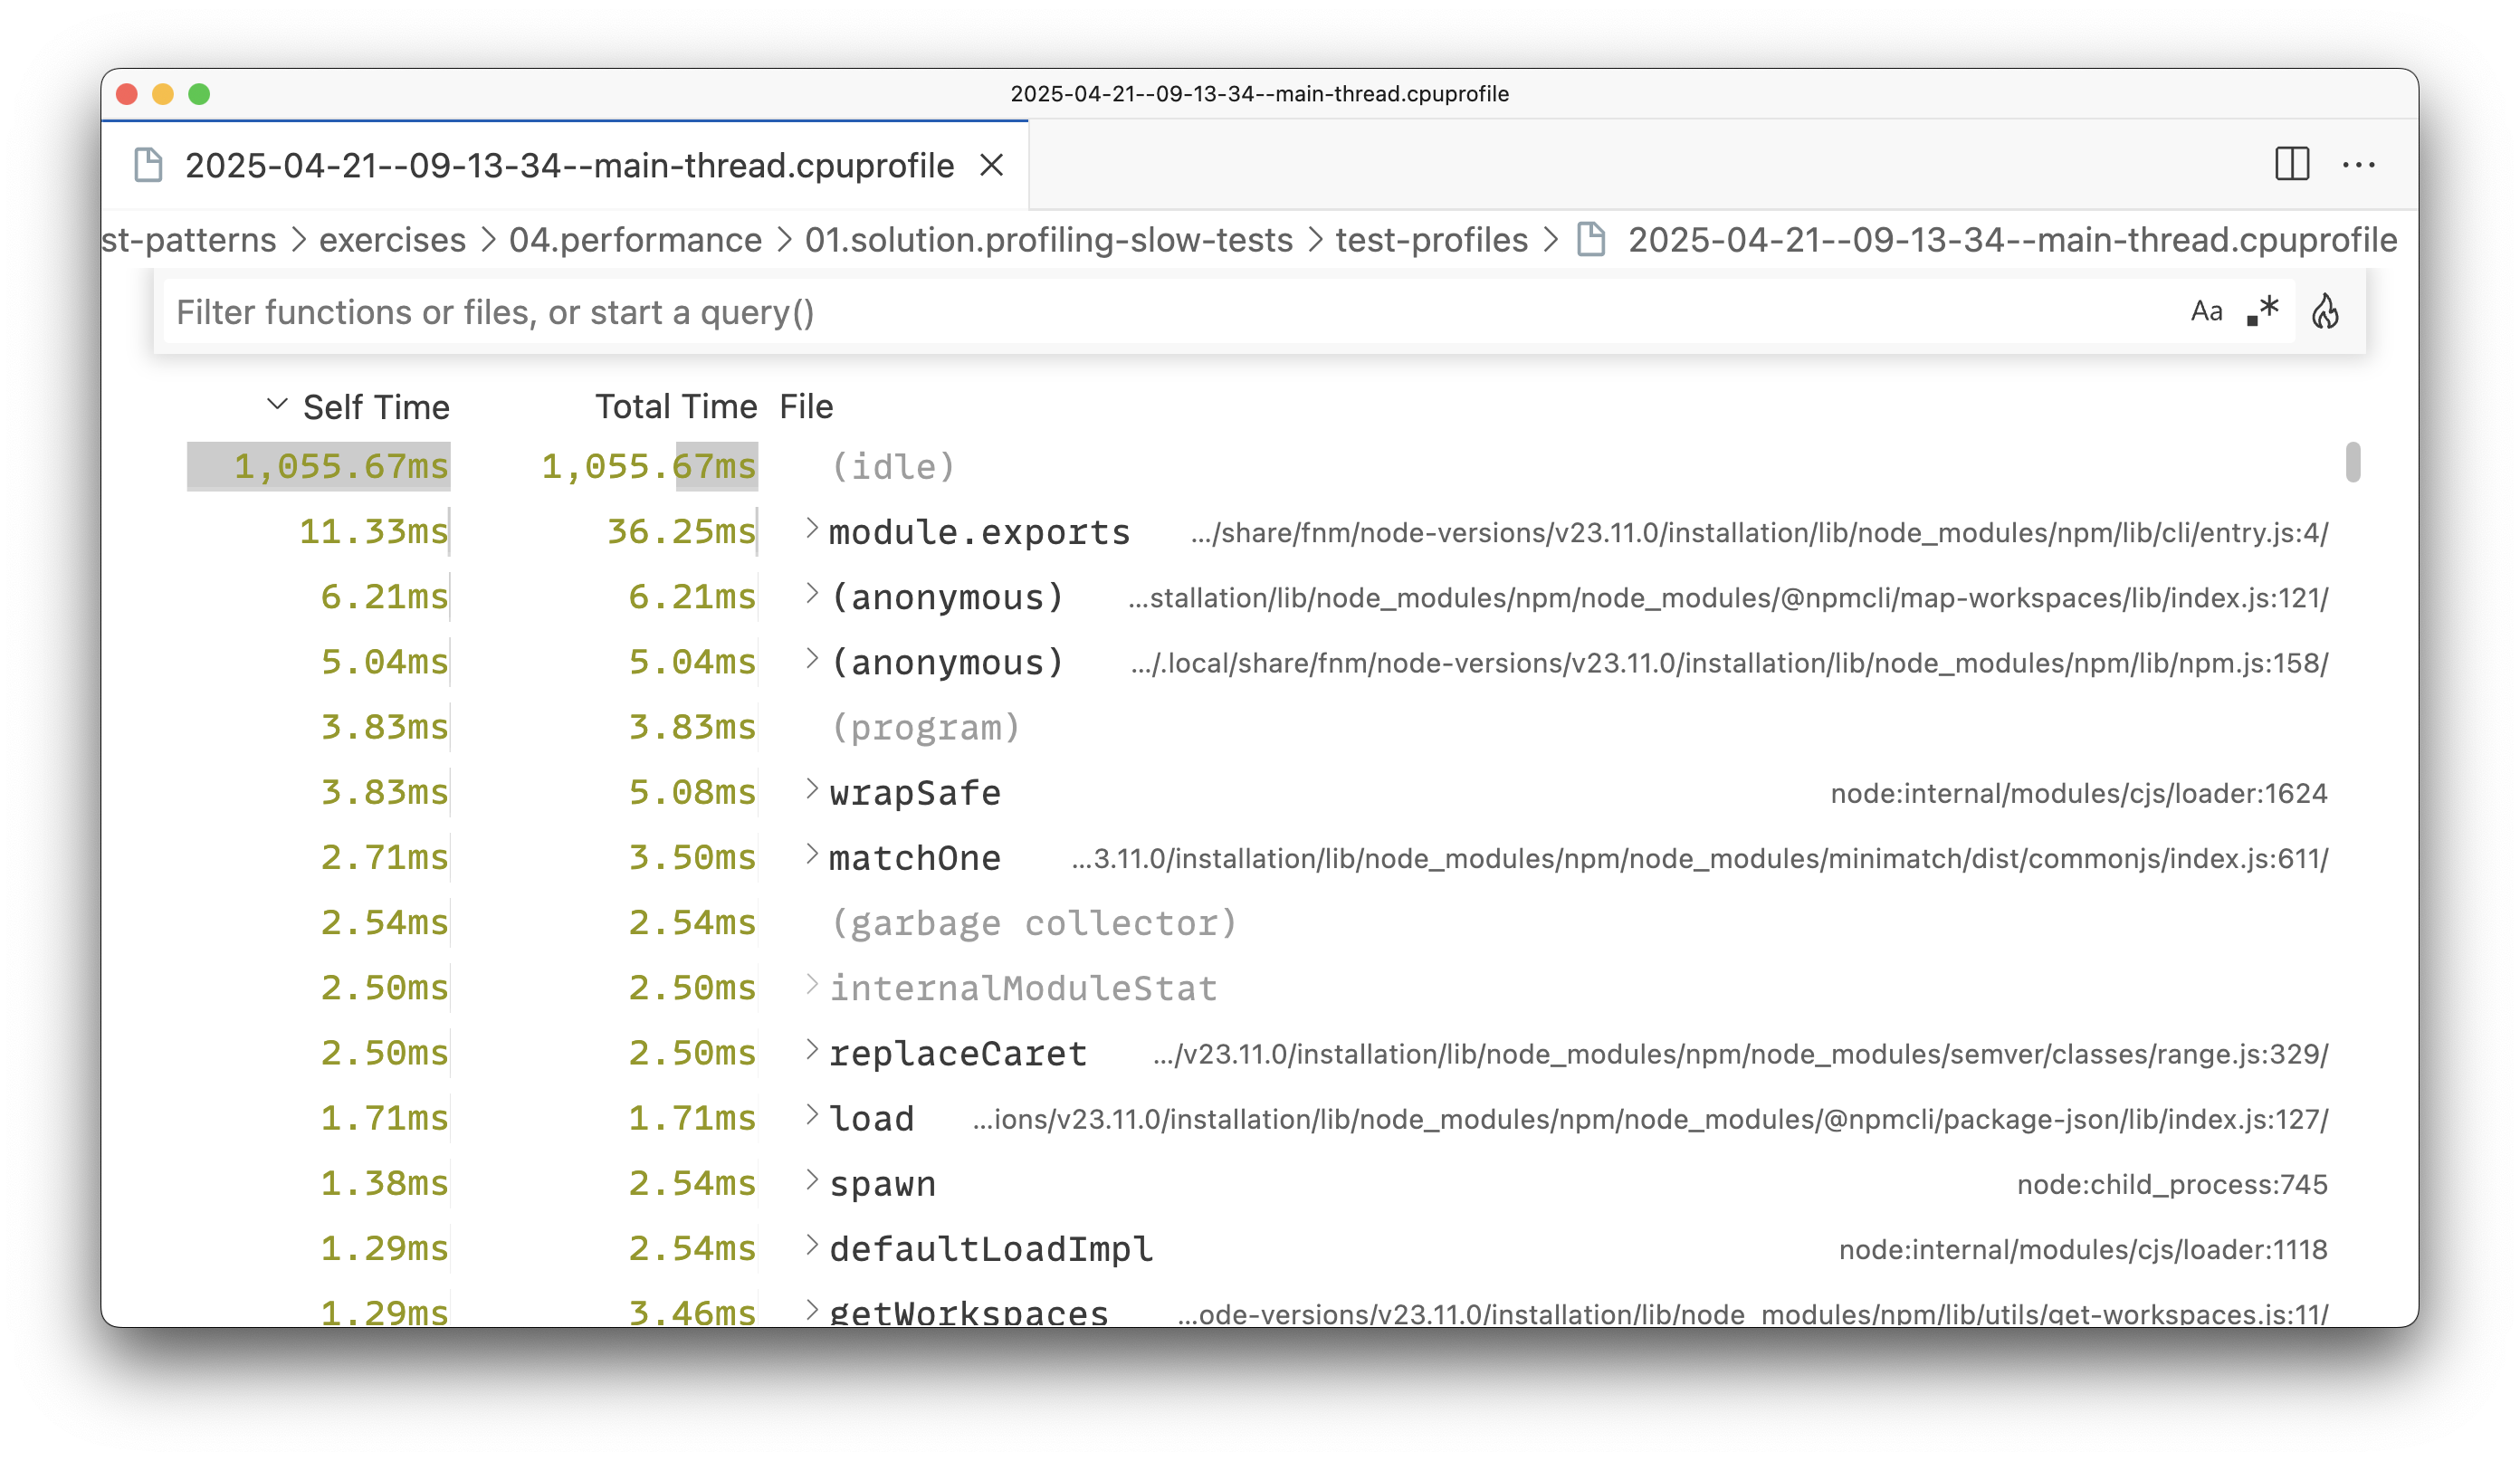
Now, if this looks intimidating, don't worry. Profiles will often contain a big chunk of pointers and stack traces you don't know or understand because they reflect the state of the entire process.
In these profiles, I am interested in spotting abnormally long execution times. Luckily, this report is sorted by "Total Time" automatically for me! That being said, I see nothing suspicious in the main thread so I proceed to the other profiles.
Test profiles
When it comes to the test performance,
vitest-profiler reports two metrics: CPU and memory profiles. Here's how they look for my test run: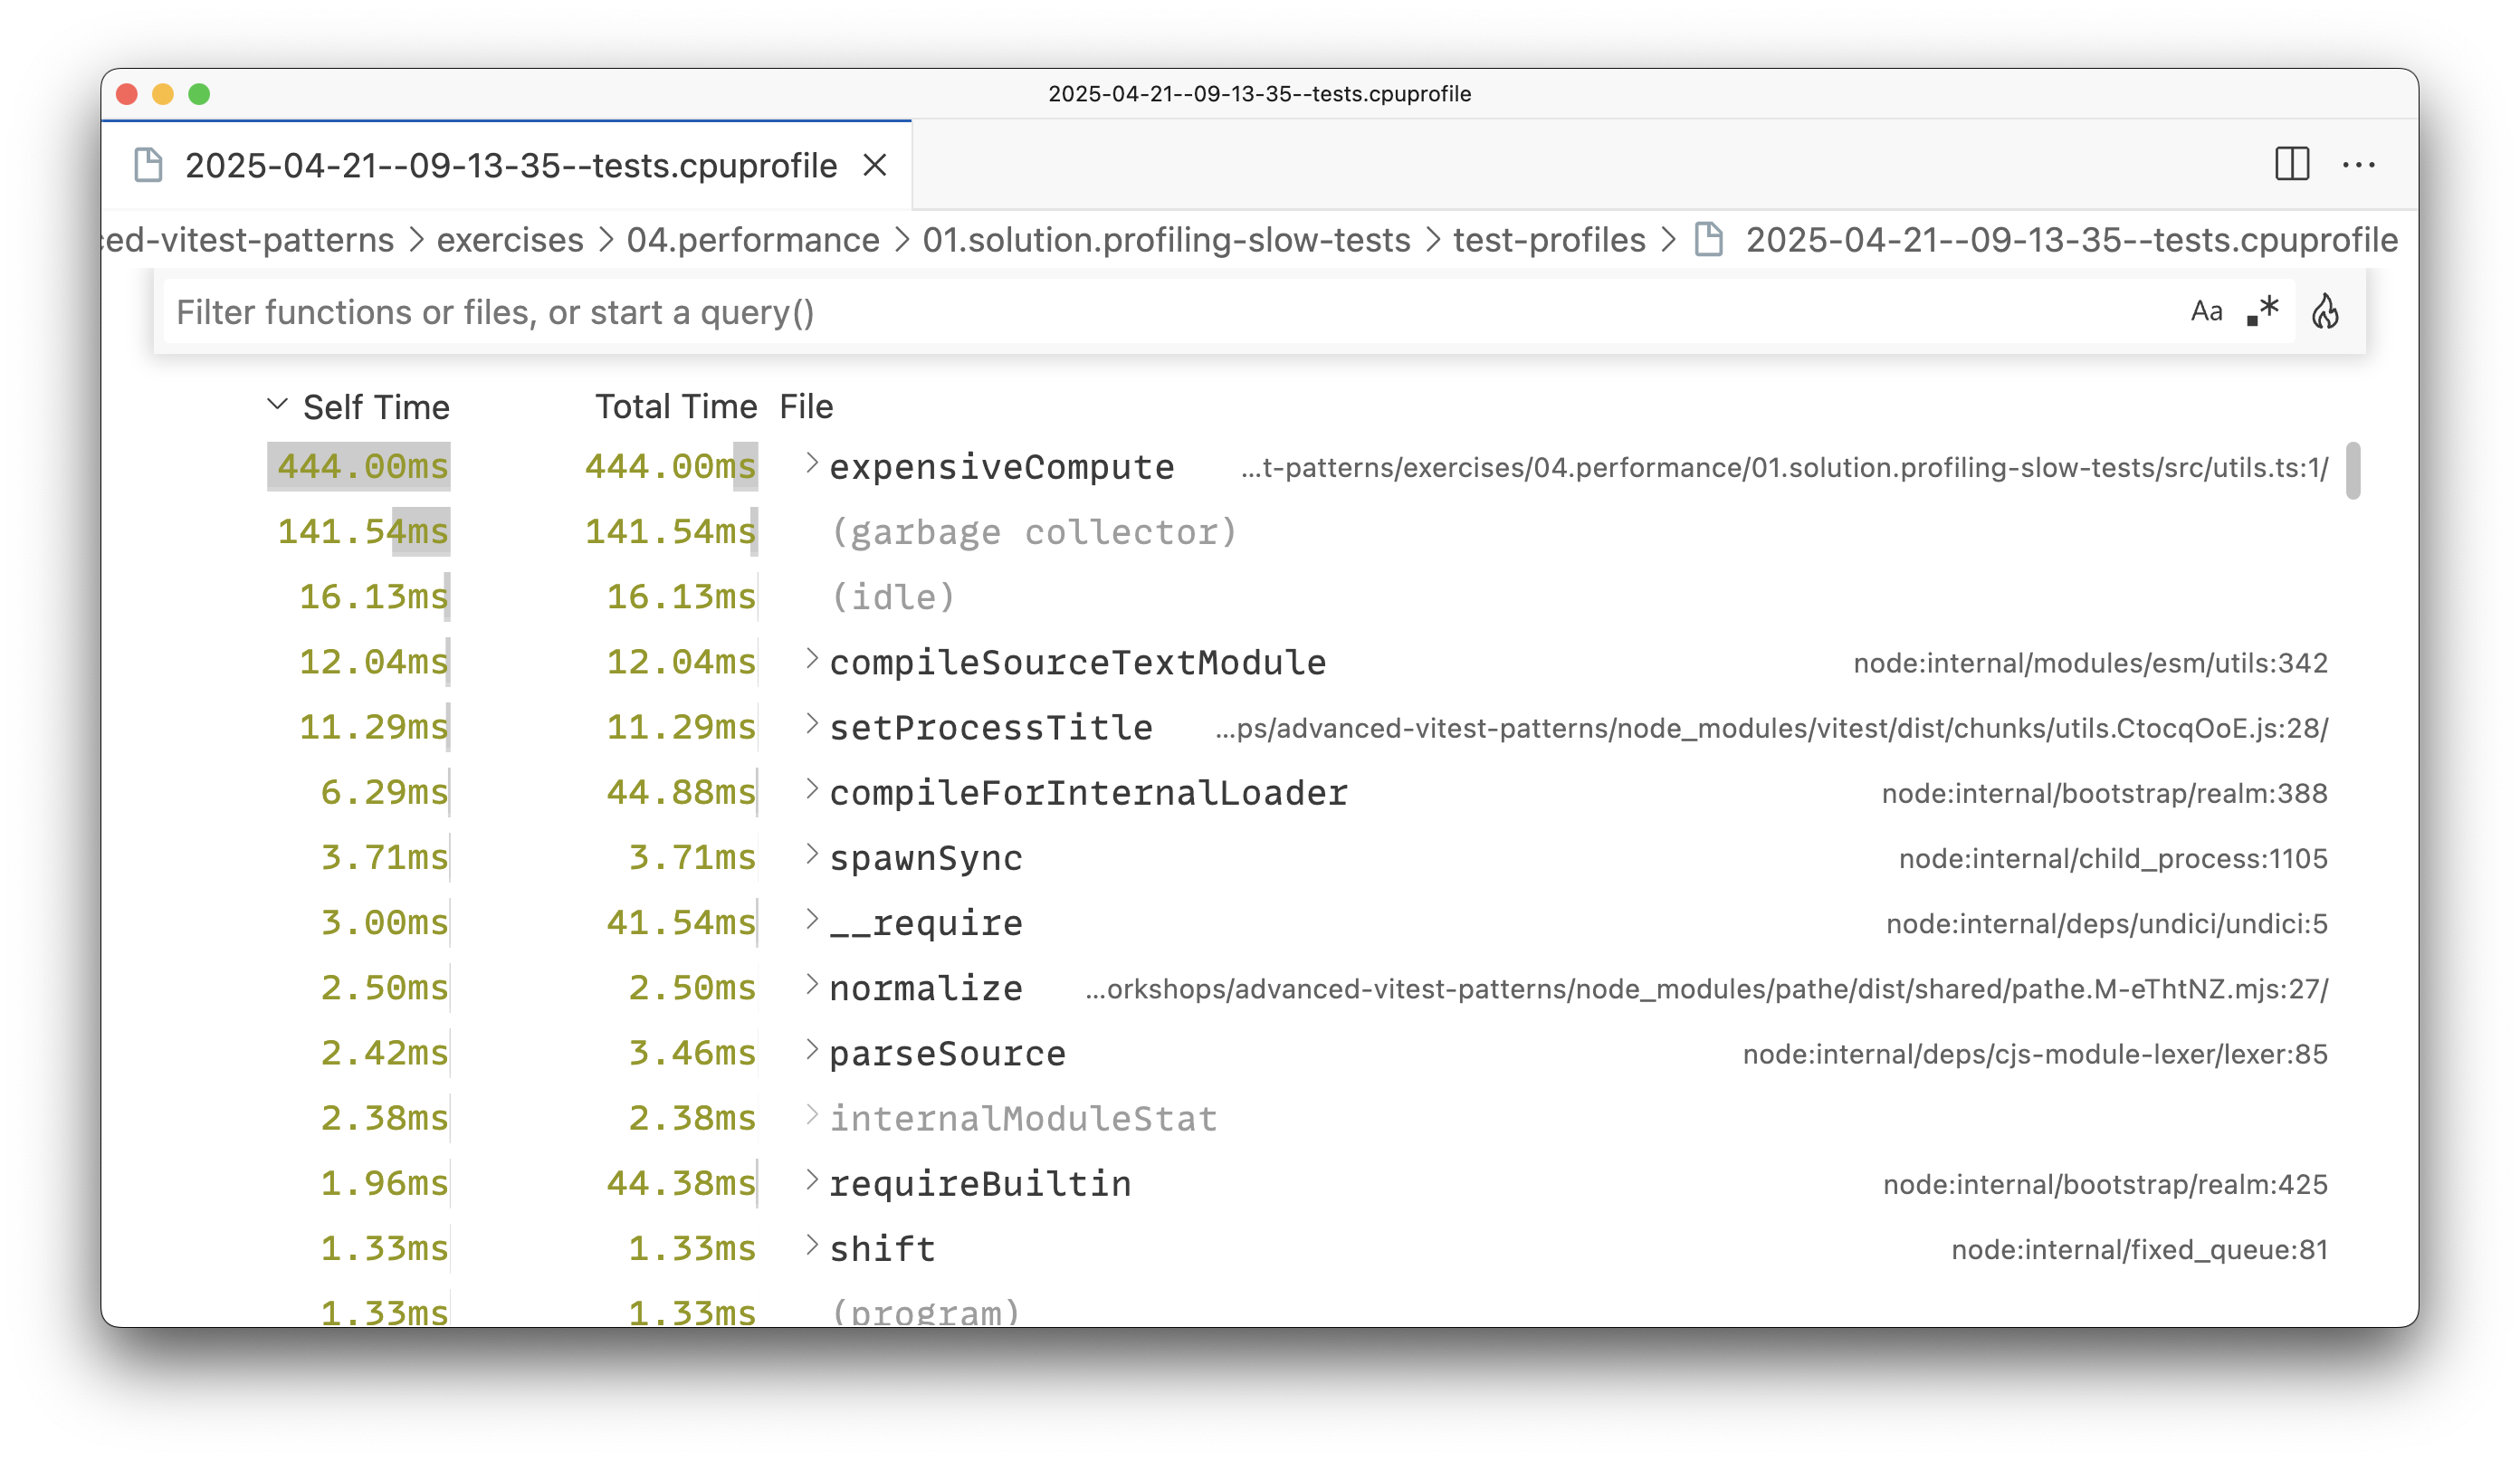
(Above) The CPU profile for the tests.
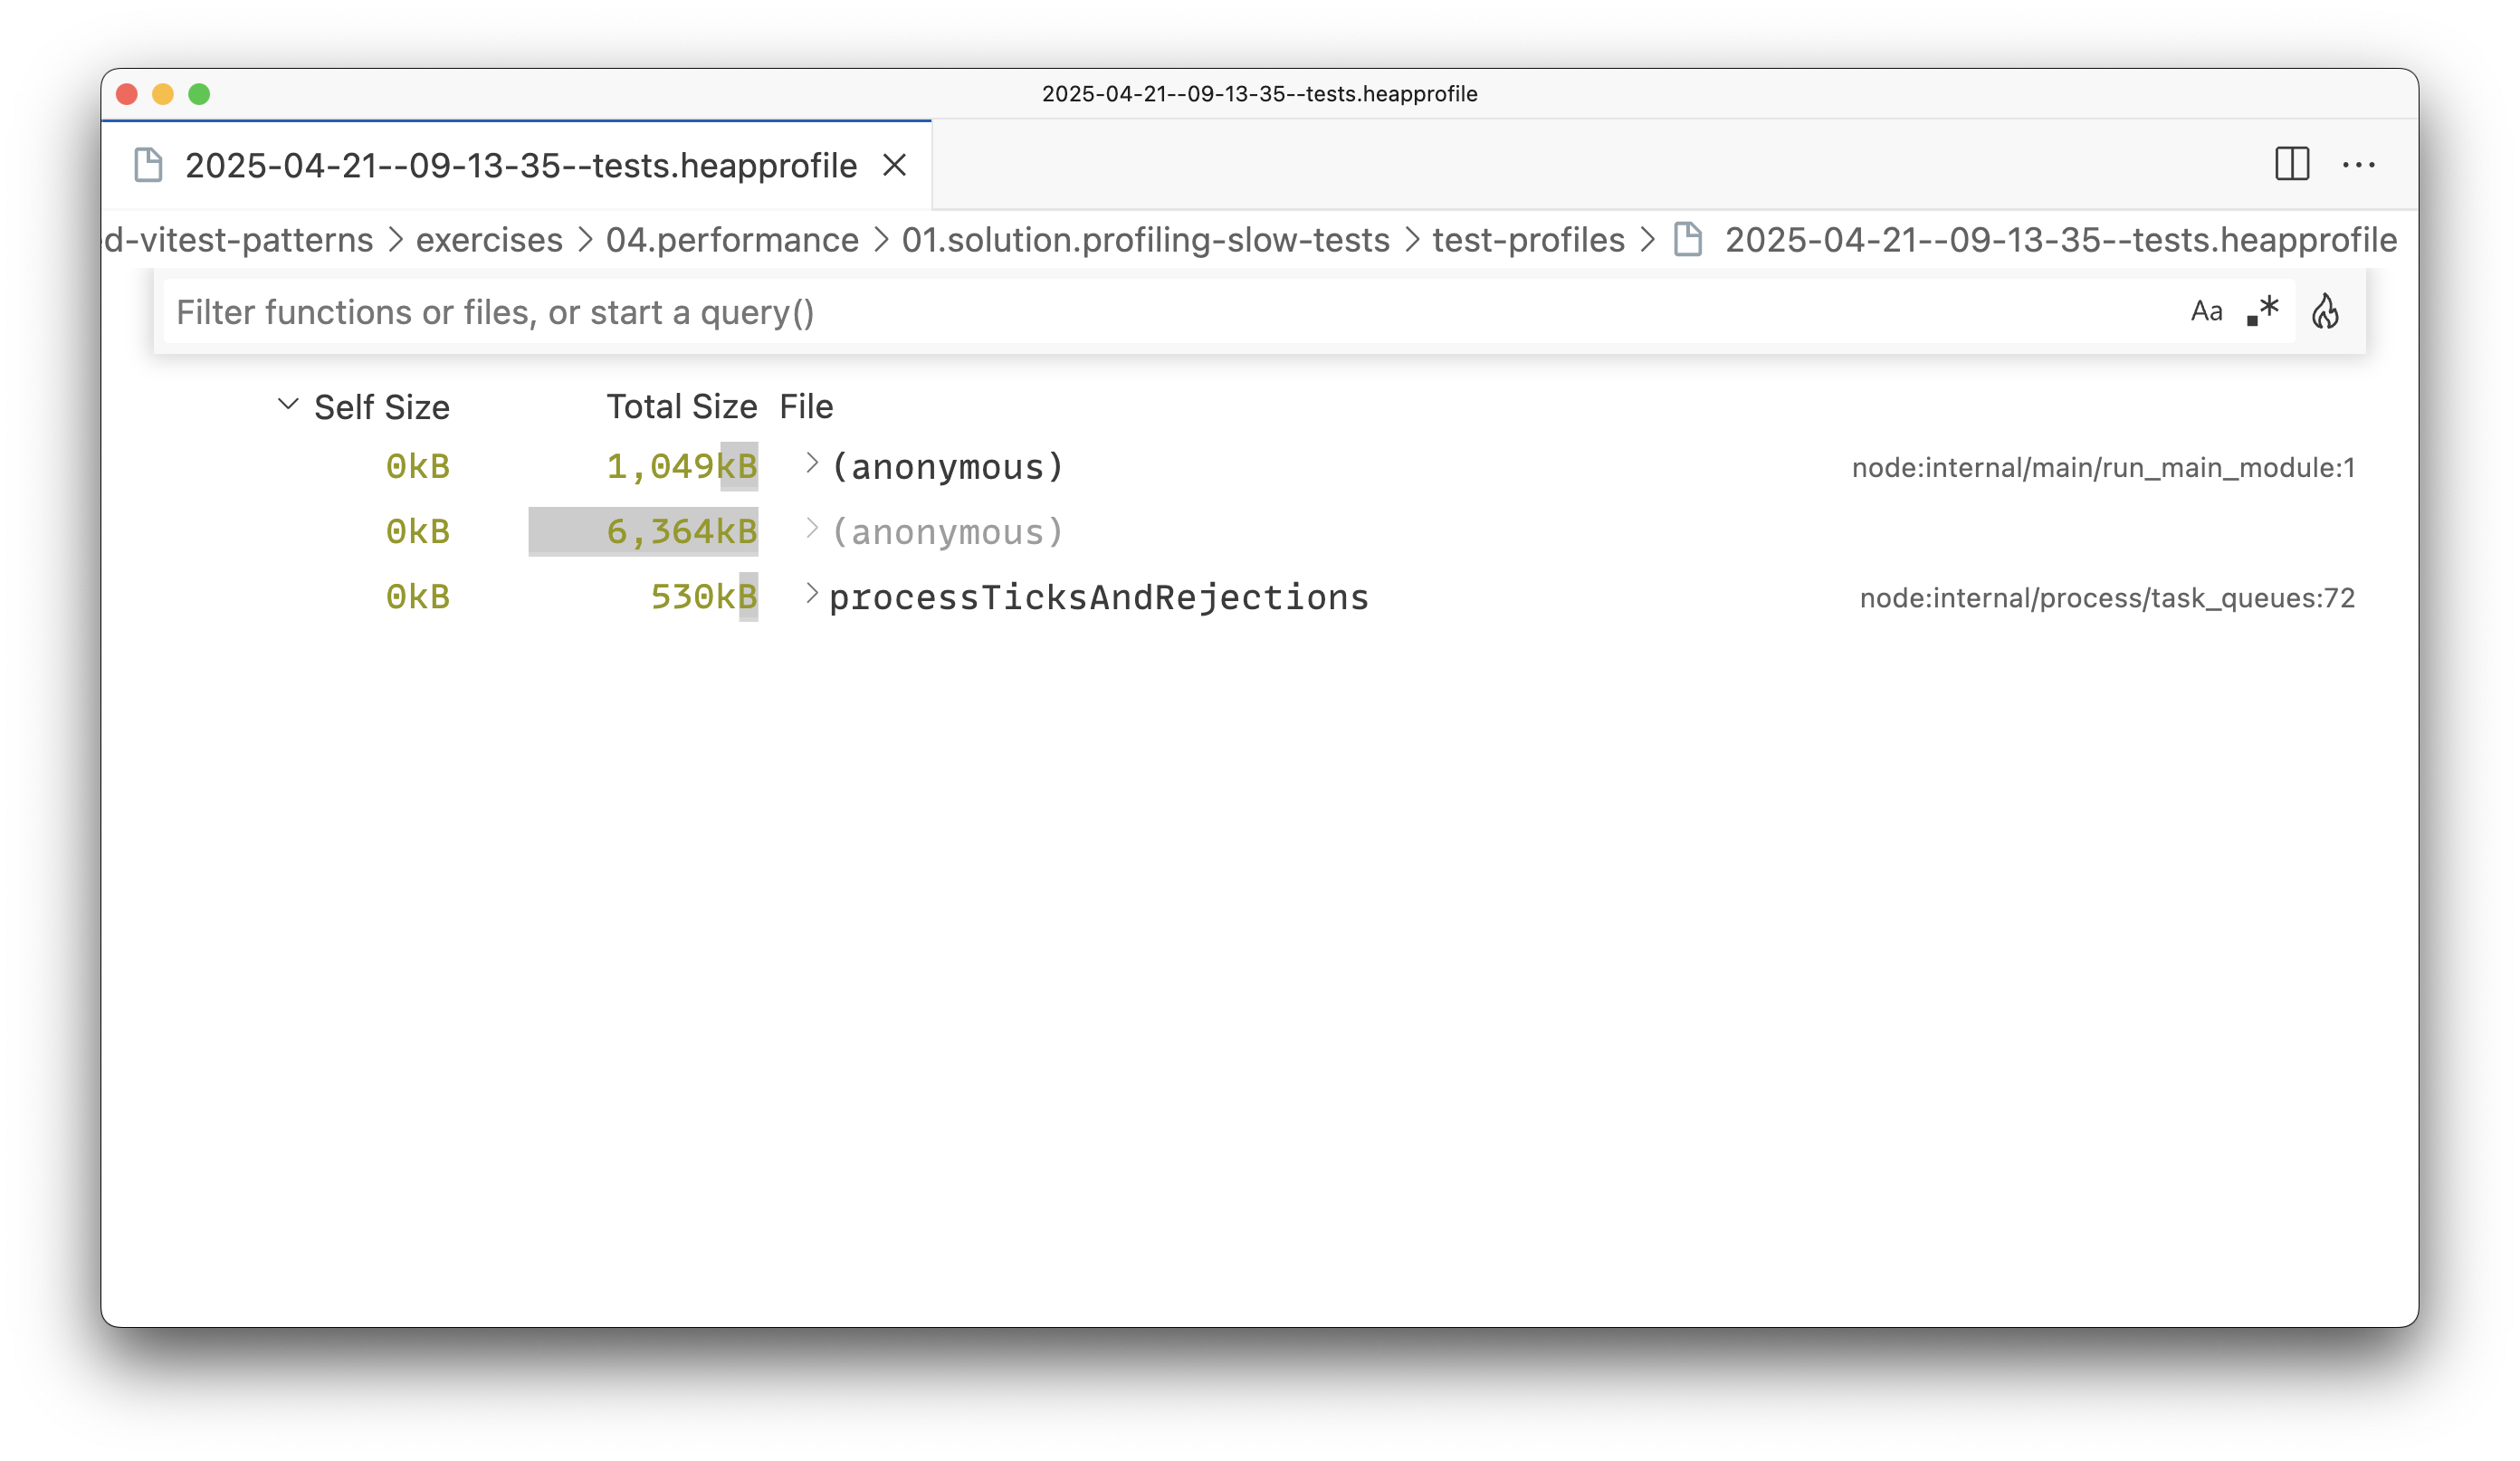
(Above) The memory (heap) profile for the tests.
While the memory consumption looks alright, I can spot from the CPU profile that the
expensiveCompute function took a whole 444ms to run. That is a lot!My next steps will be to see what makes the
expensiveCompute function so slow and whether the person who named it that was was really trying to tell us something.Conclusion
Like every bug, every performance degradation is different. I cannot outline a single "one size fits all" approach to your problem as much as I want to. Ultimately, you are the best person to do that. You are infinitely more familiar with your project, its setup, dependencies, and technical debt than I can ever be.
What I can do is teach you where to get started, and now that you know how to profile your tests, you are one step closer to fixing any performance issue you will find.
What I can also do is give you a rough idea about approaching issues based on their problem surface:
| CPU | Memory |
|---|---|
| Analyze your expensive logic and refactor it where appropriate. | Analyze the problematic logic to see why it leaks memory. |
| Take advantage of asynchronicity and parallelization. | Fix improper memory management (e.g. rogue child processes, unterminated loops, forgotten timers and intervals, etc). |
| Use caching where appropriate. | In your test setup, be cautious about closing test servers or databases. Prefer scoping mocks to individual tests and deleting them completely once the test is done. |